Know your fund's win rate before you invest.
Historical returns answer the question every SIP investor should ask: if I invest at any random time, what are my chances of making money? MF Analytics puts this probability front and centre for every fund in India.
Covering all AMFI-registered AMCs and 6,000+ active schemes
The probability-first approach to fund research
Most fund metrics tell you what happened last year. Return win rate tells you the probability of making money at any entry point — the question that actually matters for SIP investors.
Return Win Rate
See the exact probability of making money on any fund — how many historical entry dates resulted in positive returns over 1D, 1Y, 3Y, or 5Y investment horizons. The only metric designed for SIP investors.
Fund Quality Score
Every fund gets a quality score and star rating built from win rate, downside risk, and risk-adjusted return signals. Evidence-backed, not marketing copy.
Portfolio XIRR & Grade
Correct XIRR calculated from all your transactions. Portfolio health grade A–F covering concentration, Regular-plan cost drag, fund overlap, and tax harvest opportunities.
Tax-Aware Insights
LTCG harvest lots with exact remaining exemption, ELSS 80C room tracker for the current FY, and estimated expense drag — all computed from your actual holdings.
From fund discovery to portfolio and tax review
1
Screen by win rate
The screener ranks 6,000+ active funds by return win rate — the most honest measure of blind-investment probability. Filter by category, investment horizon, and track record length.
2
Check the quality score
Each fund's detail page shows a full evidence breakdown: win rate, Sharpe 3Y, Sortino 1Y, max drawdown, and consistency score — everything a quality-conscious investor needs.
3
Grade your portfolio
Add holdings manually or import your CAS PDF. Get an A–F health grade with actionable signals: concentration alerts, Regular plan cost estimates, and fund overlap checks.
4
Harvest tax alpha
Identify LTCG lots eligible for the annual exemption, track your ELSS 80C usage for the current FY, and review your estimated annual expense drag.
6,000+
active funds tracked
All AMFI-registered schemes across equity, debt, hybrid, and ELSS categories.
10+ years
return history
Win rate and median return computed from actual daily NAV history, not just trailing charts.
4 signals
per fund
Win rate, Sharpe ratio, max drawdown, and consistency score — so you can compare with confidence.
From confusion to clarity in a single session
“The win rate column changed how I think about fund selection. I stopped chasing last-year returns and started asking whether a fund is worth investing at any time.”
Ananya Sharma
Software Engineer, Mumbai
“The portfolio health grade caught two Regular plan funds I had missed for years. Switching to Direct saved me an estimated amount in annual commission costs.”
Rajesh Iyer
Chartered Accountant, Bengaluru
“The LTCG harvest view is the most practical tax tool I have seen in any MF app. I claimed the full exemption last year because of it.”
Priya Menon
Investment Consultant, Chennai
Start free. Upgrade when the data earns it.
Free
Research funds and track one portfolio at no cost.
₹0
/mo
Always free — no credit card needed
Fund quality score
Return win rate
Fund search and screener
1 portfolio
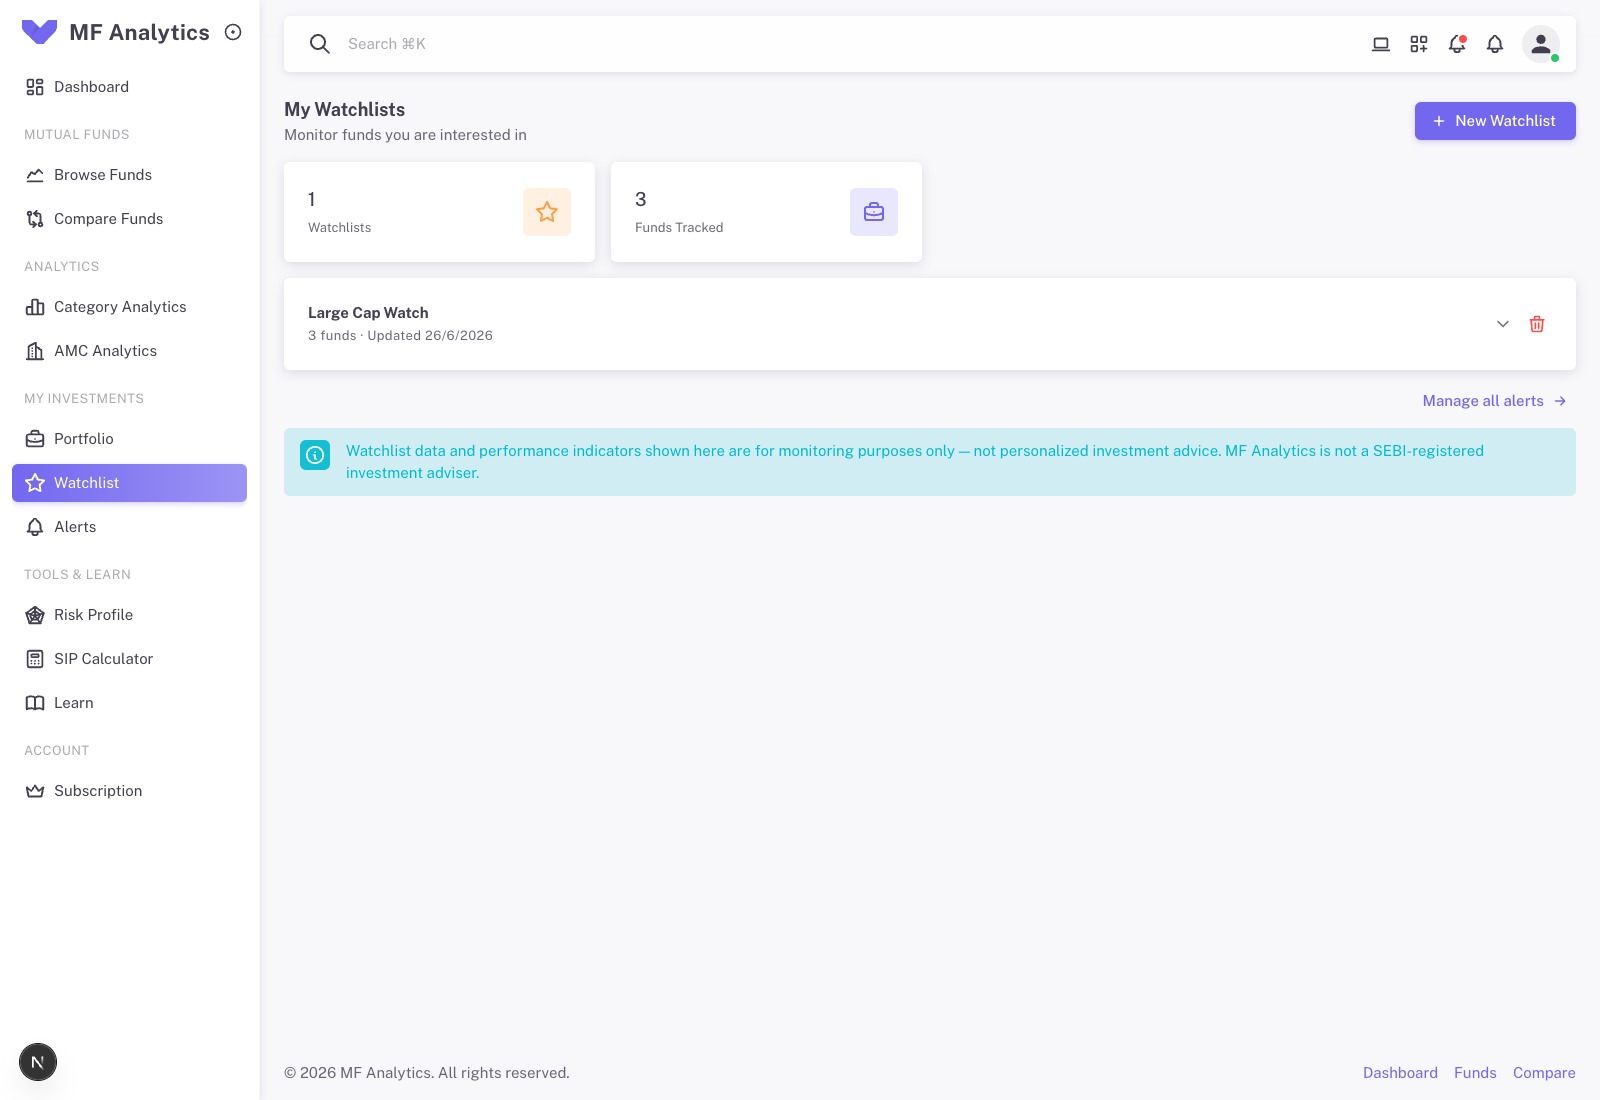
1 watchlist
SEBI disclaimer on every screen
Basic
For active investors tracking multiple funds and portfolios.
₹166
/mo
₹1,990 billed annually
Performance Quality analytics
Portfolio P&L and XIRR
Commission leak detector
CAS PDF import
3 portfolios
3 watchlists
Pro
For serious investors who need the full analytical picture.
₹416
/mo
₹4,990 billed annually
10Y return history
Tax harvest insights
ELSS 80C room tracker
Portfolio health grade A–F
SIP goal planner
10 portfolios and watchlists
Priority support
Enterprise
For advisory firms, financial planners, and investment teams.
₹1,249
/mo
₹14,990 billed annually
Unlimited portfolios and watchlists
API access
Custom reports
Dedicated account manager
White-label ready
Questions every investor asks before signing up
The quality score combines historical win rate, downside risk, and risk-adjusted return signals into a quick research shortcut. It is not investment advice; it helps you identify funds worth investigating further.
XIRR is the internal rate of return that accounts for the exact timing of all your investment transactions. We compute it from the transactions you add to your portfolio — each SIP date and amount, plus the current NAV — giving you the true annualised return, not the misleading rolling NAV change.
Under Budget 2024-25, equity mutual fund gains above a certain threshold per year are taxed at 12.5% LTCG. The harvest view shows each eligible lot and the exact remaining exemption, so you can strategically redeem and reinvest before March 31 to reset your cost basis and avoid unnecessary tax.
If any of your holdings are Regular plan funds, we estimate the annual commission paid to the distributor. This gives you a rupee-per-year drag figure per holding — factual data you can use to decide whether switching to Direct is worth it.
No. MF Analytics is a data analytics and research tool, not a SEBI-registered investment adviser. All numbers and analysis on this platform are for informational and research purposes only. They do not constitute personalised investment advice. Always conduct your own research and consult a registered adviser before making investment decisions.
AMFI data
Sourced from official AMFI India NAV feeds
No OTP required
Portfolio data stays on your account — no MF Central access needed
SEBI disclaimer
Research tool only — not investment advice. Every data screen shows the disclaimer.
Budget 2024-25
Tax rates current: LTCG 12.5%, STCG 20%, annual exemption applies
Start researching with win rate — not just past returns.
Create a free account, screen funds by return probability, and get your portfolio health grade in minutes.